Technical Analysis
By TradingRage
Ripple has been demonstrating bullish price action against both USDT and BTC recently. Investors are once again looking optimistic about the short-term future. Yet, some signs suggest that a pullback or consolidation might be on the horizon.
The USDT Paired Chart
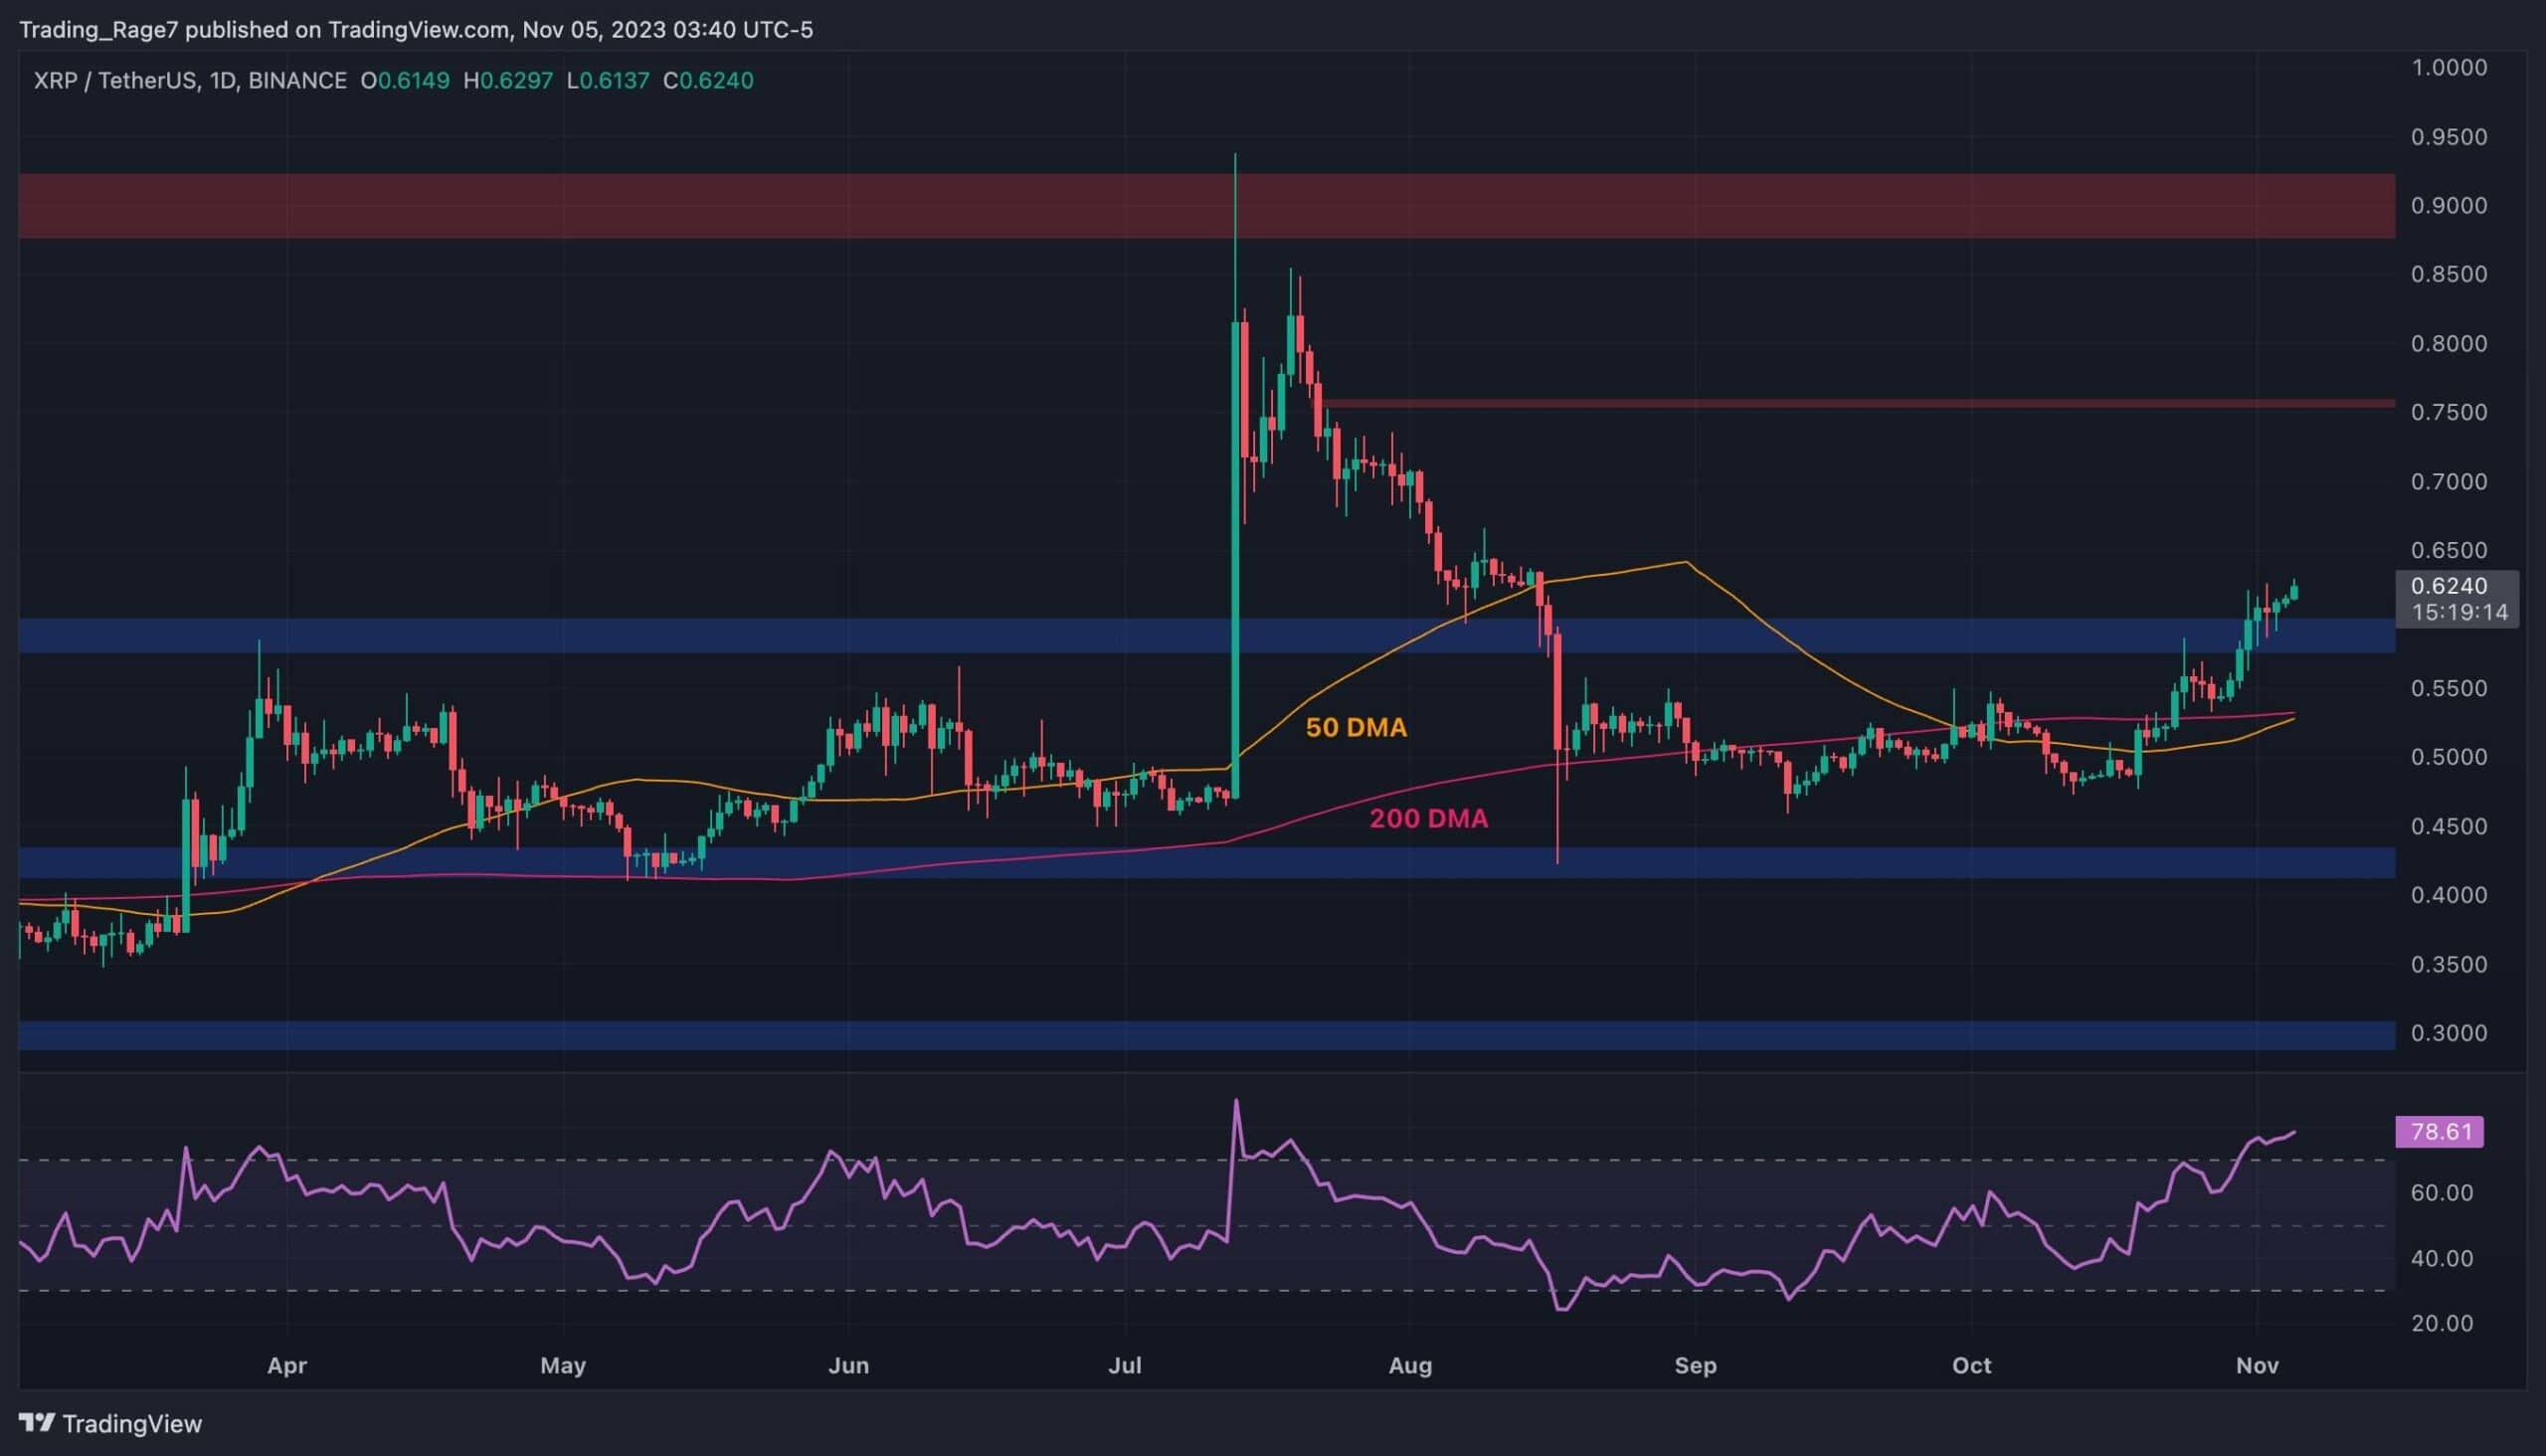
Against USDT, the price has been on a consistent rise since a rebound from the $0.5 level earlier in October. The 50-day and 200-day moving averages were also broken to the upside, confirming the bullish bias.
These moving averages are currently converging near the $0.55 mark, and a bullish crossover is likely to occur soon. Adding this signal to the fact that the price has successfully broken above the $0.6 resistance level points to a potential bullish continuation.
However, the Relative Strength Index is showing a massive warning signal, being deep into the overbought territory. Therefore, a short-term pullback seems likely in the coming days.

The BTC Paired Chart
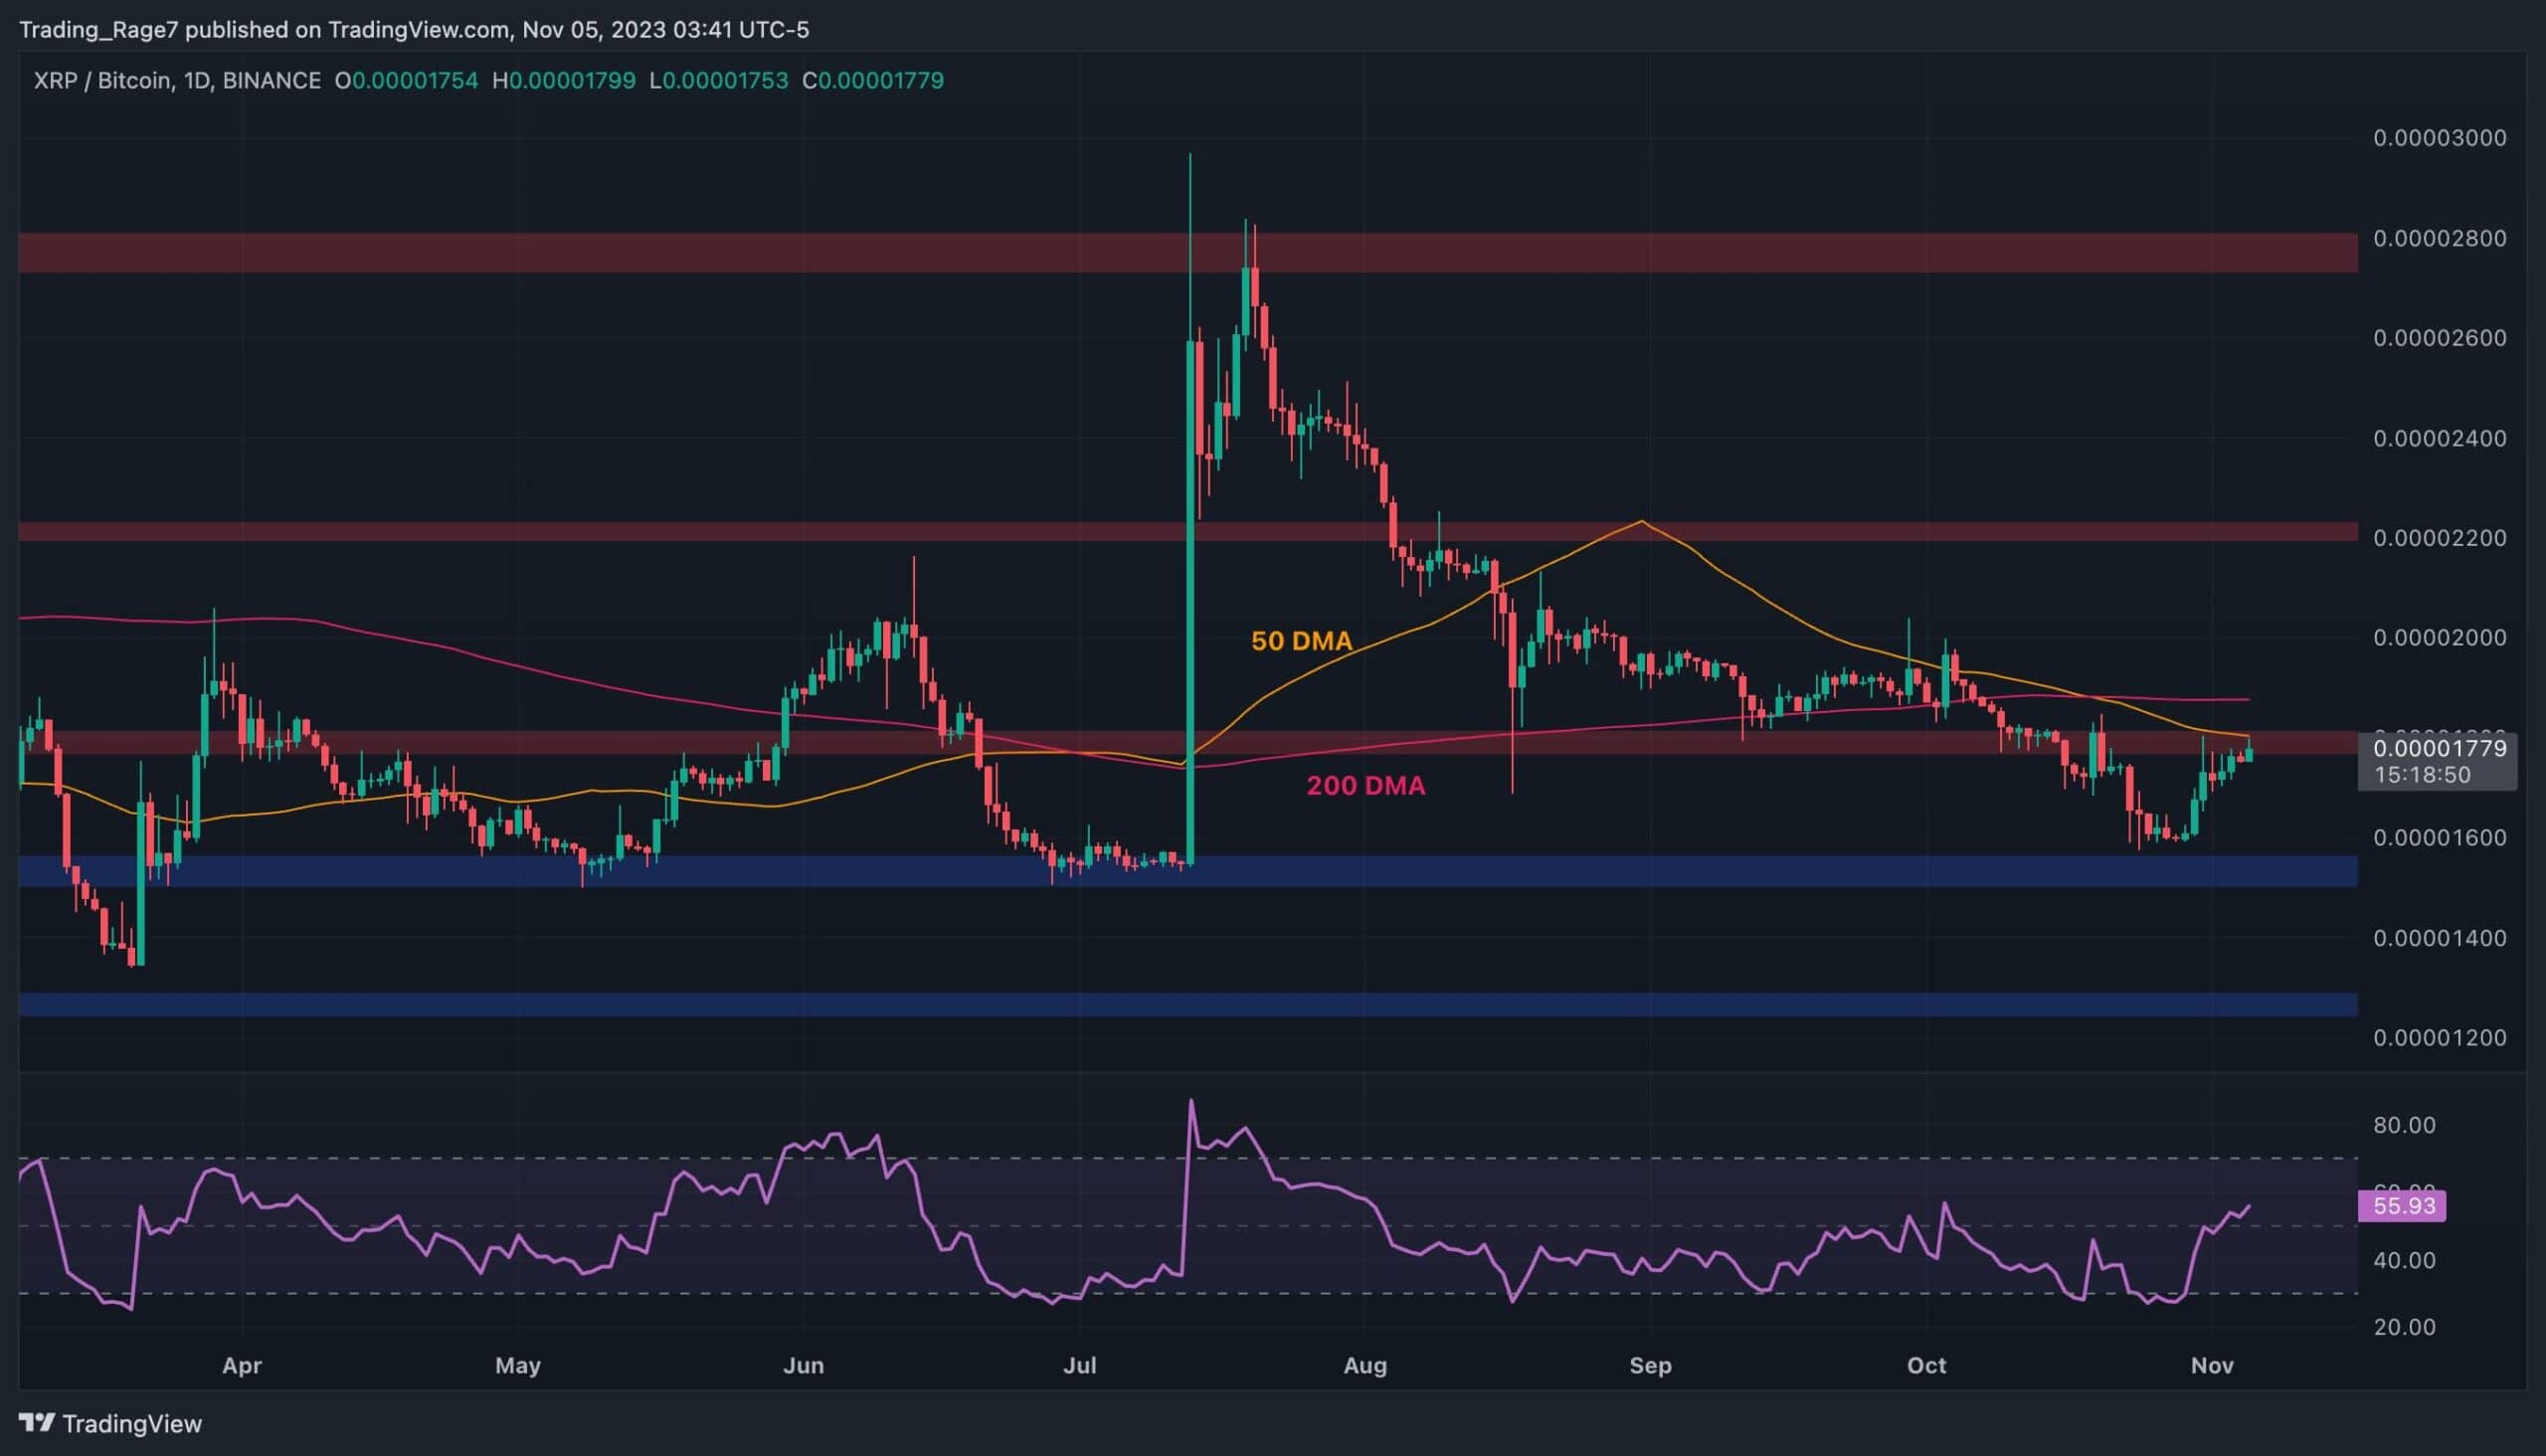
XRP’s price has also been increasing against BTC, and it is currently testing a critical area. Both the 1800 SAT resistance level and the 50-day moving average nearby are now preventing it from a further rally.
The 200-day moving average located around the 1900 SAT mark is also a significant obstacle that the price has to overcome to continue its upward trajectory. With the RSI also breaking above the 50% level, bullish continuation seems even more likely.

The post XRP Price Rally Continues: Is $0.7 Next or is a Correction Imminent? (Ripple Pirce Analysis) appeared first on CryptoPotato.
#CryptoNews #XRPAnalysis #XRPBTC #XRPUSD #Ripple(XRP)Price [Source: CryptoPotato]

