The post Chainlink Price Targets Revealed: Is $100 Closer Than We Think? appeared first on Coinpedia Fintech News
Chainlink, which ranks 15th in the crypto market, has a market cap of $9.42 billion. The LINK price is trading above the $15 mark, with a 4% surge in the last 24 hours.
As one of the rising tokens in the crypto game, Oracle is providing multiple solutions to boost real-world asset tokenization to increase global Web 3.0 adoption. In a new bull market, the Chainlink token price have surged almost 50% over the last two weeks and project a bullish trend continuation.
Will the breakout rally in Chainlink cross above the $50 mark to create a new all-time high? Let’s find out in our latest Chainlink price analysis, which is filled with technical insights and the latest updates.
Chainlink Price Performance
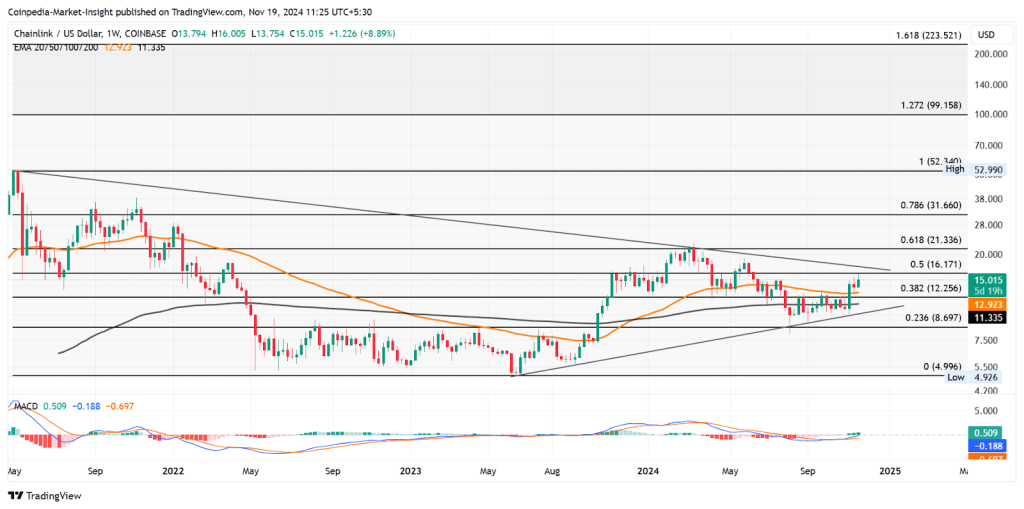
In the weekly chart, Chainlink price action shows a bullish cycle gaining momentum. The bull cycle starts within a symmetrical triangle pattern and is heading to challenge the overhead resistance trendline.

The bull cycle accounts for a 50% surge from the bullish turnaround from the $10 psychological mark. The LINK price currently trades at $15.02, challenging the 50% Fibonacci level at $16.17.
Further, the higher price direction shows a surge in supply, keeping the bullish growth under check. However, as the broader market gains momentum, the Chainlink price action shows a surge above the 38.20% Fibonacci level and the 50-week EMA line.
Technical indicators:
MACD: Supporting the bullish trend in Chainlink price, the MACD and signal lines have given a positive crossover with a surge of positive histograms.
EMA: The 50-week and 200-week EMA lines maintain a positive alignment, supporting the bullish trend.
Will The Chainlink Price Cross $20?
The uptrend will likely hit the resistance trendline, surpassing the 50% Fibonacci level at $16.17. In the short term, the immediate price targets for the Chainlink price are $21.36 and $31.66. On the other side, the crucial supports are $12 and $10.
Based on the Fibonacci levels, the triangle breakout rally could reach the $52 mark to create a new all-time high. The Fibonacci levels paint the upside targets at $99.15 and $223. Hence, the dream of Chainlink reaching the $100 psychological mark could be achieved in this new bull market.
Chainlink Announces a new RWA Tokenization solution for Fund Managers
Supporting the bullish growth ahead, the infrastructure development and the fundamental and growing adoption of Chainlink will be the crucial demand boosters for LINK tokens. In a recent announcement, Chainlink has revealed a new novel automated tokenized fund management solution for asset management companies and digital markets.
Leveraging tokenization, smart contracts, and the Chainlink infrastructure will help fund managers scale their funds across multiple chains and distributors. Chainlink’s new solution will help multiple fund management companies reduce costs and manual communications while increasing efficiency.
Furthermore, it will provide investors with higher levels of security and transparency. The new solution is live on multiple blockchain testnets and will soon go live on the mainnet.
Will the latest RWA tokenization solution boost the LINK price bull run to $100? For a long-term view, check out our Chainlink price prediction.
FAQs
Chainlink ranks #15th in the crypto market, with a $9.42B market cap.
Based on technical analysis and Fibonacci levels, LINK has the potential to surpass $50 if the bullish momentum continues.
Recent infrastructure developments, including Chainlink’s tokenized fund management solution and technical breakout patterns, support the bullish trend.
#PriceAnalysis #Chainlink(LINK) [Source: Coinpedia]

